Monitor a MinIO Tenant
This procedure documents monitoring a MinIO object storage tenant deployed on VCF 4.2.
Monitor MinIO using Prometheus
MinIO exports Prometheus compatible data as an authorized endpoint. Users can monitor MinIO tenants using any Prometheus-compatible application by scraping data from this endpoint.
This procedure assumes an existing Prometheus deployment with access to the MinIO tenant. Documentation for deploying and configuring Prometheus is outside the scope of this documentation.
1) Generate a Bearer Token
The MinIO scrape endpoint requires authentication. Prometheus supports a
bearer token approach to authenticate scrape requests. Use the
mc admin prometheus generate command to generate the required bearer token.
See https://min.io/download
for instructions on downloading mc.
mc alias set <TENANT-NAME> <TENANT-URL> <ACCESS_KEY> <SECRET_KEY>

mc admin prometheus generate <TENANT-NAME>
Replace
<TENANT-NAME>with the name of the MinIO tenant.Replace
<TENANT-URL>with the endpoint for the MinIO tenant.Replace
<ACCESS_KEY>and<SECRET_KEY>with the root credentials for the MinIO tenant.Add
--insecureif using self signed certificates.
The command returns a bearer token similar to the following:
scrape_config:
- job_name: minio-job
  bearer_token: TOKEN
  metrics_path: <PATH>
  scheme: http
  static_configs:
  - targets: ['HOSTNAME:9000']
The value of metrics_path depends on the version of mc is used to
generate the bearer token:
For
mcversion RELEASE.2021-01-16T02-45-34Z or earlier,metrics_pathis/minio/prometheus/metrics. This includes the default MinIO version used by tenants (RELEASE.2020-10-18T21-54-12Z).For MinIO tenants using MinIO version RELEASE.RELEASE.2021-01-30T00-50-42Z or later, the
metrics_pathis/minio/v2/metrics/cluster.
2) Configure Prometheus for Scraping MinIO
Prometheus uses the scrape_config section of its configuration file to define endpoints for scraping metrics.
For existing Prometheus deployments, modify the
scrape_configsection to include the newjob_nameelement and restart Prometheus.For new Prometheus deployments, ensure the
scrape_configsection includes the MinIO job_name element before starting Prometheus.
The Prometheus service must have access to the MinIO tenant. For Prometheus servers deployed as part of the VCF Tanzu infrastructure, you need to modify the configuration map used to instantiate each Prometheus pods with the new scrape job.
3) Validate Metric Collection
Prometheus has a built-in expression browser for ad-hoc queries.
Alternatively, you can use any application which supports querying Prometheus, such as Grafana. MinIO publishes a first-party Grafana Dashboard designed to collect all monitoring stats for MinIO tenants.
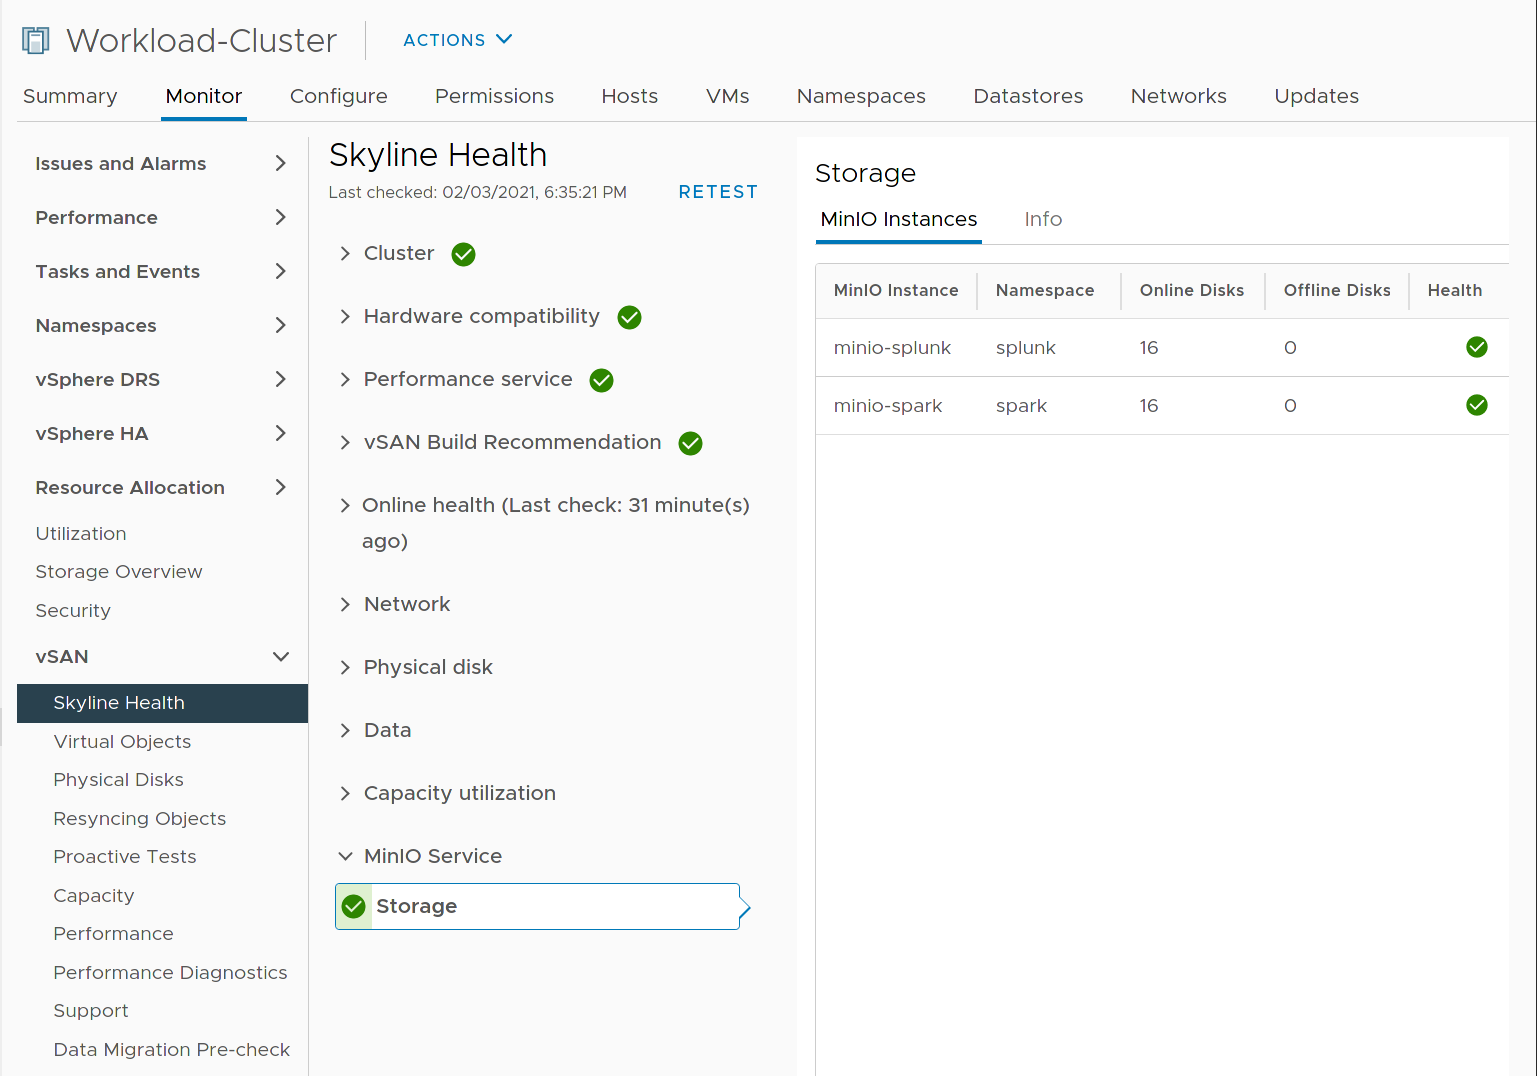
Monitor MinIO using VMware Skyline Health
MinIO reports the health status of each tenant to VMware Skyline Health.
From the vCenter interface, select the cluster in which you want to deploy the MinIO tenant.
Click the Monitor tab, then open the vSAN section and select Skyline Health.

MinIO lists health checks related to each tenant under the MinIO Service section.

